
How much nitrogen is needed to establish seeded bermudagrass?
Common bermudagrass (Cynodon dactylon L.) is used on golf courses in temperate regions. Historically, seeded bermudagrass was considered inferior to vegetative hybrid varieties due to lower turf quality. However, genetic advancements have improved the quality of seeded cultivars, making them comparable to vegetative ones (19, 20 and 21). Turf managers increasingly utilize seeded bermudagrass for its flexibility in establishment, greater genetic diversity, improved winter hardiness and lower establishment costs (7, 24 and 29).
While annual nitrogen (N) requirements for established bermudagrass are well-studied, optimal N requirements for establishing seeded bermudagrass are unclear (8, 10 and 26). Previous studies suggest applying 1.0 lbs. N per 1,000 ft² every 15 days from seeding until mid-September (24) or using the same monthly N rate after seed emergence until four weeks before an anticipated hard frost (23 and 25).
Although applying 1.0 lbs. N per 1,000 ft² every four weeks after emergence is recommended, some turfgrass managers use higher rates, up to 1.0 lbs. N per week to hasten canopy coverage (12 and 13). However, frequent high N applications with soluble sources can lead to poor rooting, excessive shoot growth, reduced rhizome and stolon mass, water quality issues from runoff and leaching and unnecessary economic costs due to wasted fertilizer and labor (6).
Reducing application frequency and using controlled-release fertilizers may lower total nitrogen (N) requirements during establishment and reduce off-target N movement (2, 5, 14 and 15). A two-year field study was conducted to determine the optimal N establishment program for a seeded bermudagrass cultivar on native soil, using two N sources with varying application rates and frequencies.
Materials and Methods
A two-year field study was conducted in the summer of 2020 and 2021 at the William H. Daniel Turfgrass Research and Diagnostic Center in West Lafayette, Ind., on Starks silt loam soil with a pH of 7.1 and 5.2 percent organic matter. ‘Rio’ bermudagrass was seeded at 1.0 lbs. pure live seed per 1,000 ft² using a drop spreader, with seeds polymer-coated by the manufacturer. The area was covered with a vegetative blanket to prevent seed movement, which was removed after germination (~21 days). Light and frequent irrigation maintained soil moisture until germination.
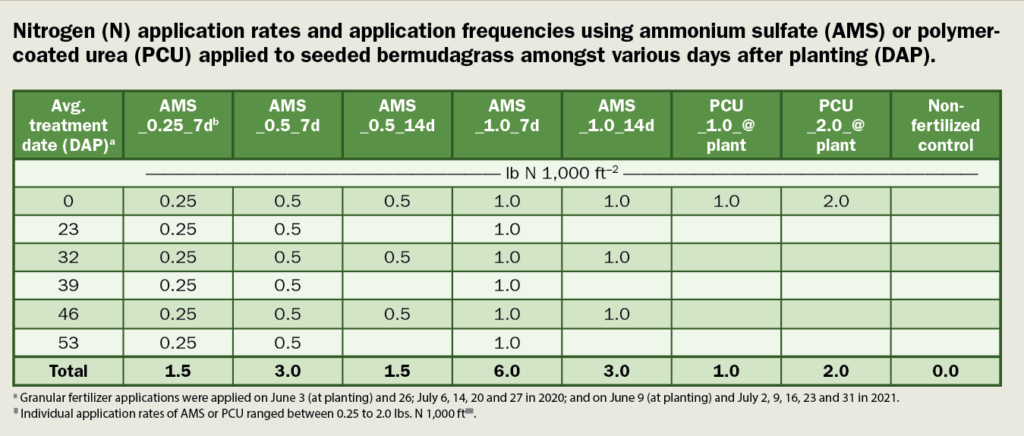
The study evaluated eight granular nitrogen (N) grow-in programs, varying in N source, application rate and frequency. Fertilizer sources included ammonium sulfate (21-0-0) and polymer-coated urea (44-0-0). Total N application ranged from 0.0 to 6.0 lbs. N per 1,000 ft², with treatments applied at planting or seven- or 14-day intervals after germination. Weather data were monitored using an on-site station.
Fertilization began on June 3 of 2020, and ammonium sulfate (AMS) applications were repeated on June 26, July 6, 14, 20 and 27. In 2021, fertilization started on June 9, with repeat applications on July 2, 9, 16, 23 and 31. We applied irrigation (0.2 inches) after each N application. We used a postemergent herbicide (carfentrazone) to control broadleaf weeds and manually removed annual grassy weeds.
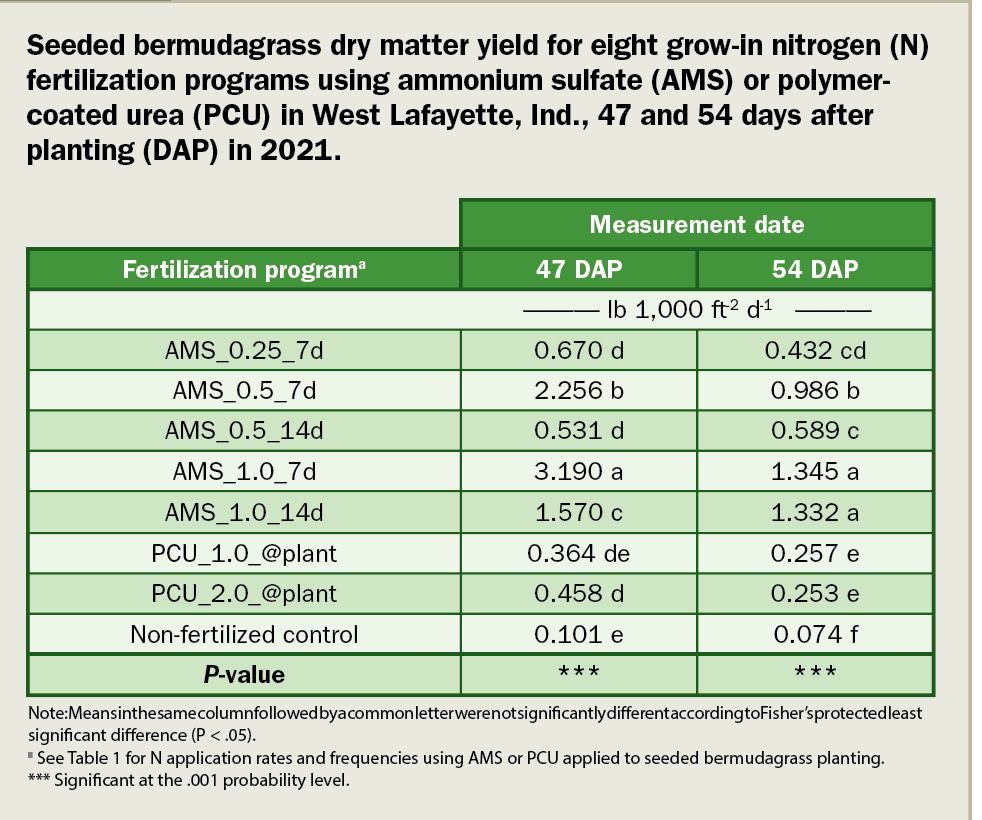
The research team first mowed plots ~30 days after planting (DAP) at a height of 0.5 inches with clippings collected. We then mowed every 5–7 days thereafter. In 2021, we measured dry matter yield (DMY) at 47 and 54 DAP to assess how N programs affected mowing requirements. We mowed the turf, collected leaf tissue, dried it at 155 degrees F for five days and calculated DMY as lbs. per 1,000 ft² per day.
We assessed green coverage using digital image analysis, capturing images approximately every five days after germination (18). We used a Canon PowerShot G12 camera and a light box with LED lights to ensure consistent lighting. To calculate the percent of green coverage, we used the Turf Analyzer software (17) and establishment rates for 50, 75 and 90 percent green coverage (GC50, GC75, GC90) estimated using a four-parameter sigmoidal regression model in GraphPad Prism (4).
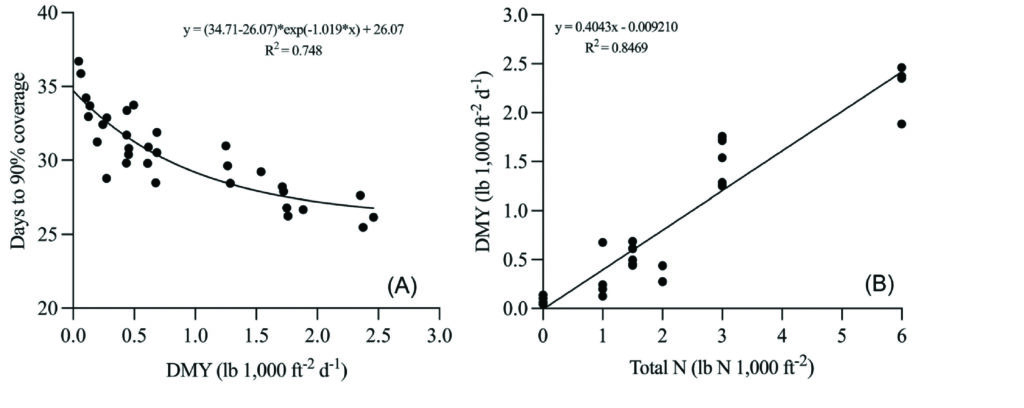
The team modeled the relationship between days to 90 percent green coverage, total nitrogen (N) rates and average dry matter yield (DMY) using an exponential decay equation. Linear regression was applied to evaluate the relationship between total N rates and average DMY. We conducted the study in a randomized complete block design with four replications. Plots measured 3 × 8 feet with 1-foot borders, and data were analyzed using analysis of variance (ANOVA) with significant differences determined by Fisher’s LSD test at P < .05.
Establishment and Relative Growth
Seeded bermudagrass establishment was influenced by year, total N rate and application frequency. The establishment was five to 10 days slower in 2021 compared to 2020, likely due to environmental differences (Table 2). In 2020, the average daily temperatures 60 days after planting (DAP) were 64.5 degrees F (minimum) and 87.3 degrees F (maximum), with 5.3 inches of rainfall and 1,578 growing degree days (base 50 degrees F). In 2021, temperatures were similar (64.4 and 83.4 degrees F), but rainfall was higher (8.7 inches) and growing degree days were lower (1,474), likely contributing to the slower establishment.
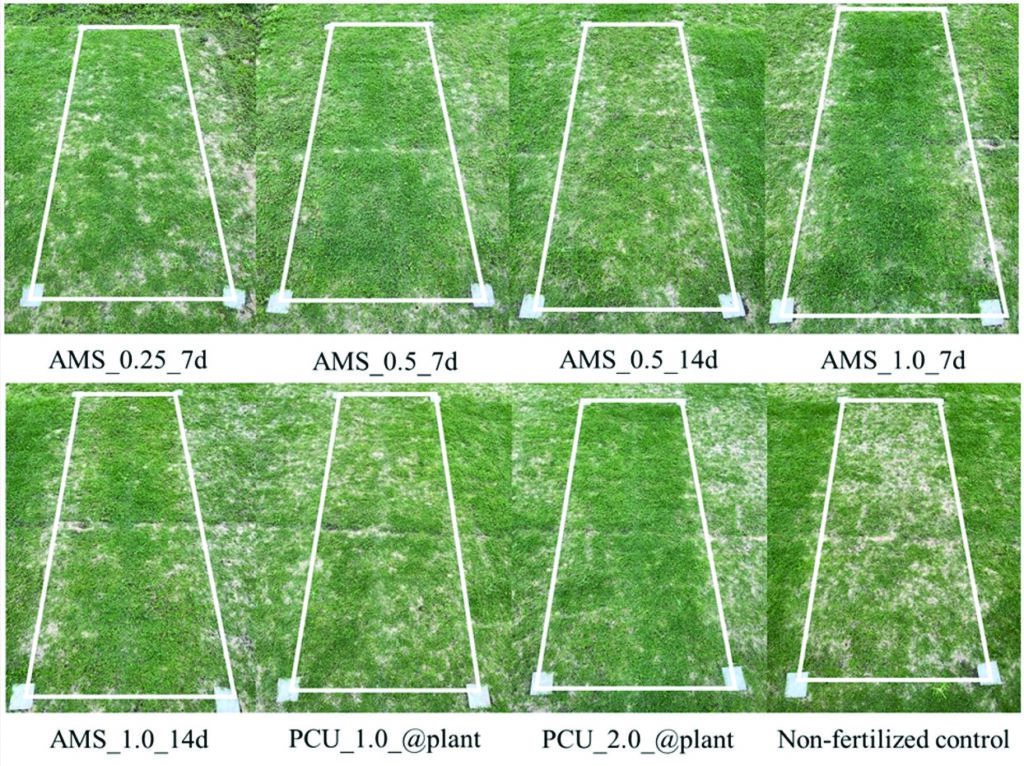
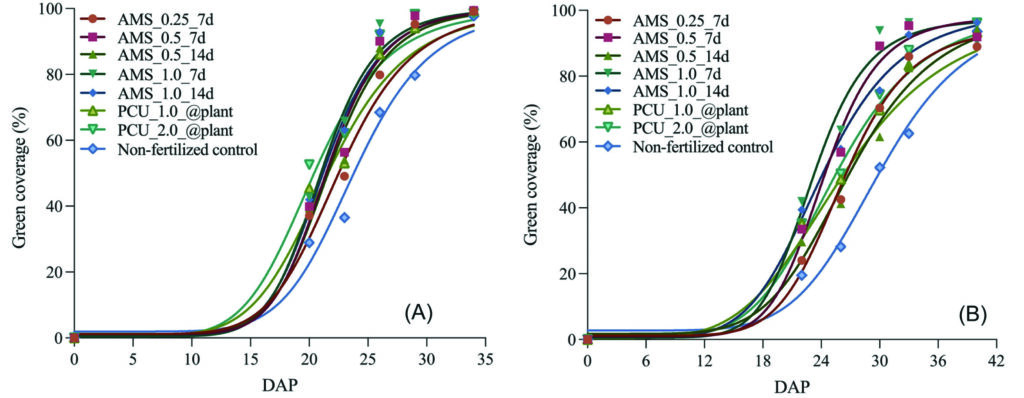
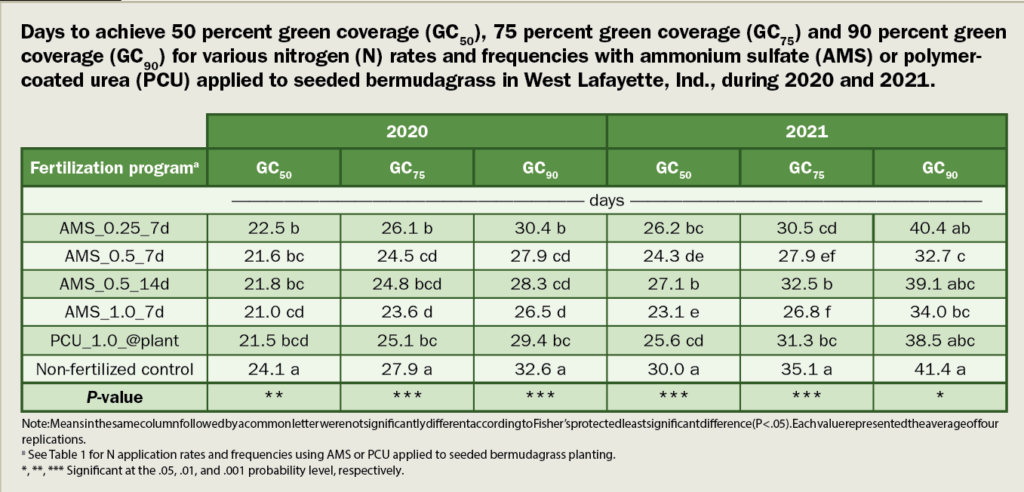
The non-fertilized control had the slowest establishment rate for GC50, GC75 and GC90 compared to all nitrogen (N) programs (Table 2). For N fertilizer treatments, the 2020 time to green coverage (Figure 1) was the following:
- GC50: Ranged from 20.1 to 24.1 days across treatments. PCU_2.0_@plant reduced days to GC50 compared to AMS_0.25_7d, AMS_0.5_7d, and AMS_0.5_14d.
- GC75: Ranged from 23.6 to 27.9 days. PCU_2.0_@plant and AMS_1.0_7d reduced GC75 by ~2.1 days compared to PCU_1.0_@plant and AMS_0.25_7d.
- GC90: Ranged from 26.5 to 32.6 days. AMS_1.0_7d and AMS_1.0_14d reduced time to GC90 by 5.7 days compared to the non-fertilized control.
In 2020, all treatments achieved 100-percent green coverage (data not shown). Fertilization programs using AMS (2.0, 3.0 and 6.0 lbs. N per 1,000 ft²) and PCU (2.0 lbs. N per 1,000 ft² applied at planting) reached GC90 in similar time frames (Figure 3).
The times to green coverage in 2021 were slightly slower (Figure 2):
- GC50: Ranged from 23.1 to 30.0 days across treatments.
- GC75: AMS_0.5_7d and AMS_1.0_7d reduced time to GC75 by 7.8 days compared with the non-fertilized control.
- GC90: Ranged 32.7 to 41.4d for AMS_0.5_7d and non-fertilized control, respectively.
Differences in establishment time between PCU treatments were not observed in 2021.
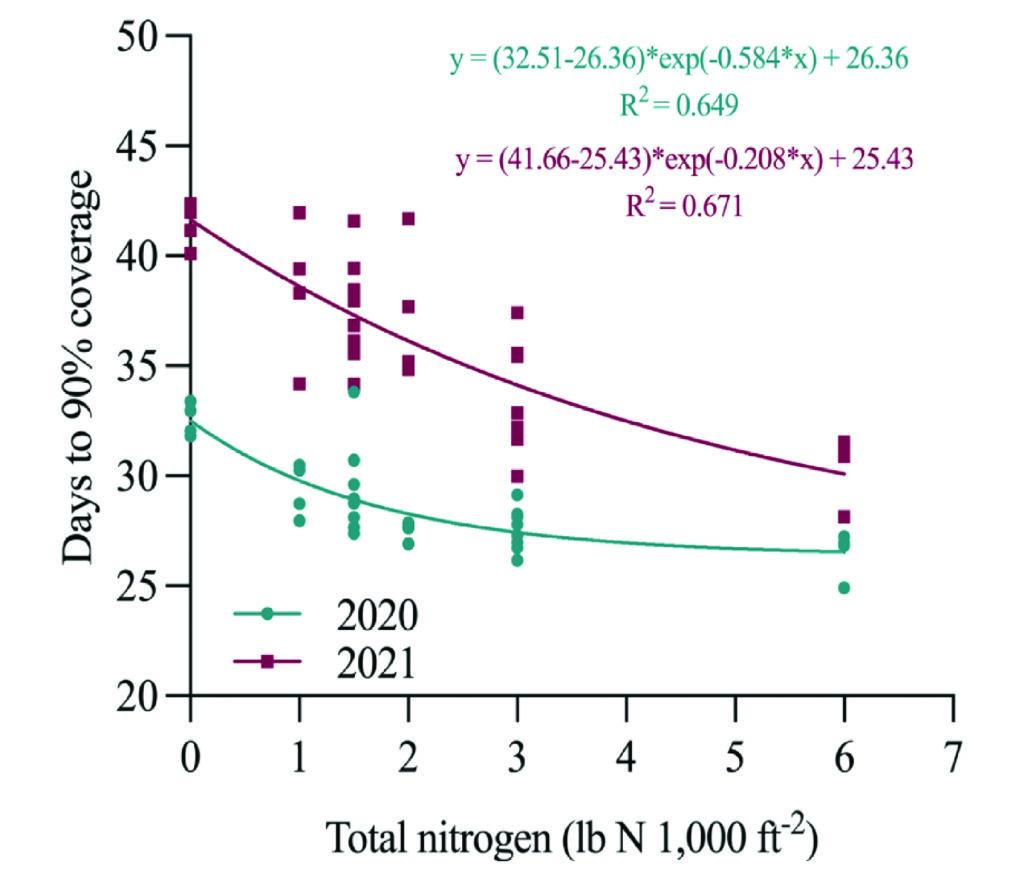
For dry matter yield (DMY) measured in 2021, AMS_1.0_7d showed an increase of 97 and 94 percent compared with the non-fertilized control at 47 and 54 days after planting (DAP), respectively (Table 3). In 2021, an exponential decay model evaluated the relationship between DMY and GC90. The results demonstrate that fertilization programs with higher rates of total nitrogen successfully reduced the time to reach GC90. Simple linear regression showed that during the first 60 days after planting (DAP), DMY increased by 0.4 lbs. per 1,000 ft² per day for every 1.0 lbs. of total supplemental nitrogen applied, suggesting a correlation with accelerated green coverage.
Discussion and Conclusion
Establishing bermudagrass from seed offers turfgrass managers greater flexibility in renovation timing, simpler soil preparation and potential cost savings compared to using sod or sprigs (24). However, nitrogen (N) is crucial for seedling growth, and there is often a temptation to apply it excessively (e.g., 1 lbs. N per 1,000 ft² per week) in hopes of quickly achieving full green coverage.
This study confirms that while N fertilization is vital during seedling establishment for promoting growth and coverage, over-application can lead to increased dry matter yield (DMY), requiring more frequent mowing without hastening the time to 90 percent green coverage (GC90). Programs like AMS_0.5_7d, AMS_1.0_14d and PCU_2.0_@plant, which involve less frequent N applications or lower total N, achieved similar milestones in ground coverage (GC50, GC75 and GC90) as the more intensive AMS_1.0_7d program but with reduced mowing needs and overall N input.
Although the study did not measure this directly, observations suggest that programs with reduced N applications meet coverage milestones at similar rates and improve initial canopy density and overall turf quality compared to lower N rates or no fertilization.
Research has been conducted on the total nitrogen (N) requirements for establishing seeded and vegetative bermudagrass. Yet, comparative studies on the establishment rates between soluble nitrogen sources (like AMS) and controlled-release products (like PCU) are sparse (12, 13, 16, 22 and 23). While this study did not measure it, factors such as N rate, application frequency and the availability of N among different fertilizer sources could influence N loss through pathways like nitrate leaching, runoff and ammonia volatilization (1,6 and 14).
Rice et al. (28) reported that lower N rates (0.25 or 1.0 lbs. N per 1,000 ft² per week) resulted in similar establishment rates for bermudagrass from sprigging at higher rates but with reduced inorganic N loss. Moderately higher N rates (a total of 2.0 to 3.0 lbs. N per 1,000 ft²) could enhance bermudagrass stolon density, decrease surface runoff and improve water infiltration compared to non-fertilized turf (6, 11 and 28).
Additionally, controlled-release fertilizers potentially decrease nitrate leaching and ammonia volatilization while improving nitrogen use efficiency compared to soluble nitrogen sources. Controlled-release products might offer a more environmentally sustainable option for fertilizing bermudagrass during establishment (3, 31 and 32).
This study suggests that the total N rates, application frequencies and the types of N sources used for bermudagrass establishment need further evaluation, particularly outside the optimal planting period and across different geographical locations. Early to late-autumn N applications may impact fall color retention, winter survival, carbohydrate status and spring greening, mainly when applied near the onset of bermudagrass dormancy (9, 23, 27 and 30). These data were not part of this study since N applications only occurred in June and July.
The study found that polymer-coated urea (PCU), particularly PCU_2.0_@plant, the highest N rate applied at planting, effectively met turf establishment needs due to its slow and steady N release. While PCU_2.0_@plant achieved similar green coverage times as other AMS programs, other controlled-release fertilizers might slow the establishment rate due to their slower N release than the PCU used in this study.
Despite total N applied 53 days after planting (DAP) varying from 0.0 to 6.0 lbs. N per 1,000 ft², the study achieved more than 90 percent green coverage before the final fertilizer application, indicating that a single application of PCU_2.0_@plant or an initial application of AMS followed by a repeat application after germination could suffice for optimal green coverage during the seeding period.
Cost considerations, including labor and the price of specific fertilizer sources, are crucial for turf managers. For example, the study highlighted that using AMS might increase labor costs significantly compared to a single application of PCU due to the different application frequencies required. Although more expensive per pound of N than AMS, PCU could save costs through reduced labor.
In summary, applying 2.0 to 3.0 lbs. N per 1,000 ft² during the first 60 DAP in June on silt-loam soil was adequate for maximizing seedling establishment without excessive dry matter yield (DMY), thereby avoiding increased mowing needs and potential damage to young plants.
Acknowledgements
Adapted from Powlen, J. S., and Bigelow, C. A. 2024. Seeded bermudagrass establishment as affected by nitrogen source, rate, and application frequency. Crop, Forage & Turfgrass Management, 10,e20250. https://doi.org/10.1002/cft2.20250
For more information, contact Jada Powlen, Ph.D., Department of Horticulture and Landscape Architecture, Purdue University, jpowlen@purdue.edu.
References
- 1. Barton, L., & Colmer, T. D. (2006). Irrigation and fertilizer strategies for minimizing nitrogen leaching from turfgrass. Agricultural Water Management, 80, 160–175. https://doi.org/10.1016/j.agwat.2005.07.011
- 2. Bigelow, C. A., Walker, K. S., & Hardebeck, G. A. (2007). Single fall applications of coated urea fertilizers produce a high quality Kentucky bluegrass turf. Applied Turfgrass Science, 4, 1–10. https://doi.org/10.1094/ATS-2007-0702-01-RS
- 3. Braun, R. C., & Bremer, D. J. (2018). Nitrous oxide emissions from turfgrass receiving different irrigation amounts and nitrogen fertilizer forms. Crop Science, 58, 1762–1775. https://doi.org/10.2135/cropsci2017.11.0688
- 4. Braun, R. C., Patton, A. J., Braithwaite, E. T., & Kowalewski, A. R. (2020). Establishment of low-input turfgrass from seed with patch and repair mixtures: Mulch and starter fertilizer effects. Crop Science, 60, 3362–3376. https://doi.org/10.1002/csc2.20266
- 5. Briscoe, K., Miller, G., Brinton, S., Bowman, D., & Peacock, C. (2012). Evaluation of ‘Miniverde’ bermudagrass and ‘Diamond’ zoysiagrass putting green establishment using granular fertilizer applications. HortScience, 47, 943–947. https://doi.org/10.21273/HORTSCI.47.7.943
- 6. Burwell, Jr., R. W., Beasley, J. S., Gaston, L. A., Borst, S. M., Sheffield, R. E., Strahan, R. E., & Munshaw, G. C. (2011). Losses of surface runoff, total solids, and nitrogen during bermudagrass establishment on levee embankments. Journal of Environmental Quality, 40, 1241–1248. https://doi.org/10.2134/jeq2010.0458
- 7. Deaton, M. T., & Williams, D. W. (2013). Temperature effects on the speed and completion of germination of 19 commercially available seeded bermudagrass cultivars. HortTechnology, 23, 82–85. https:// doi.org/10.21273/HORTTECH.23.1.82
- 8. Fry, J. D., & Huang, B. (2004). Applied turfgrass science and physiology. John Wiley & Sons Inc.
- 9. Goatley, Jr., J. M., Maddox, V. L., & Hensler, K. L. (1998). Late-season applications of various nitrogen sources affect color and carbohydrate content of ‘Tiflawn’ and Arizona common bermudagrass. HortScience, 33, 692–695. https://doi.org/10.21273/HORTSCI.33.4.692
- 10. Goldsby, A., Fry, J., & Chhetri, M. (2022). Evaluation of late-season nitrogen source application on autumn color and winter injury of ‘Riviera’ bermudagrass in the upper transition zone of the United States. International Turfgrass Society Research Journal, 14, 565–568. https://doi.org/10.1002/its2.116
- 11. Gross, C. M., Angle, J. S., & Welterlen, M. S. (1990). Nutrient and sediment losses from turfgrass. Journal of Environmental Quality, 19, 663–668. https://doi.org/10.2134/jeq1990.00472425001900040006x
- 12. Guertal, E. A., & Evans, D. L. (2006). Nitrogen rate and mowing height effects on TifEagle bermudagrass establishment. Crop Science, 46,1772–1778. https://doi.org/10.2135/cropsci2006.01-0006
- 13. Guertal, E. A., & Hicks, C. A. (2009). Nitrogen source and rate effects on the establishment of’TifSport’ and ‘Tifway’ hybrid bermudagrass. Crop Science, 49, 690–695. https://doi.org/10.2135/cropsci2008.07.0436
- 14. Guertal, E. A., & Howe, J. A. (2012). Nitrate, ammonium, and urea leach- ing in hybrid bermudagrass as affected by nitrogen source. Agronomy Journal, 104, 344–352. https://doi.org/10.2134/agronj2011.0262
- 15. Guillard, K., & Kopp, K. L. (2004). Nitrogen fertilizer form and associated nitrate leaching from cool-season lawn turf. Journal of Environmental Quality, 33, 1822–1827. https://doi.org/10.2134/ jeq2004.1822
- 16. Johnson, B. J. (1973). Herbicides, sprigging rates, and nitrogen treatments for establishment of Tifway bermudagrass. Agronomy Journal, 65, 969–972. https://doi.org/10.2134/agronj1973. 00021962006500060037x
- 17. Karcher, D. E., Purcell, C. J., Richardson, M. D., Purcell, L. C., & Hignight, K. W. (2017). A new Java program to rapidly quantify several turfgrass parameters from digital images. In ASA, CSSA and SSSA International Annual Meetings (p. 109–313). ASA, CSSA, and SSSA.
- 18. Karcher, D. E., & Richardson, M. D. (2013). Digital image analysis in turfgrass research. In J. C. Stier, B. P. Horgan, & S. A. Bonos (Eds.), Turfgrass: Biology, use, and management (Agronomy Monograph 56, pp. 1133–1149). ASA, CSSA, and SSSA.
- 19. Martin, D. L., Wu, Y., Anderson, J. A., Anderson, M. P., Bell, G. E., & Walker, N. R. (2007). Bermudagrass cultivars with high quality and improved cold hardiness. USGA Turfgrass and Environmental Research Online, 6, 1–8.
- 20. Morris, K. (1997). 1992 National bermudagrass test. Final Report NTEP No. 97–9. National Turfgrass Evaluation Program, Beltsville Agriculture Research Center, Beltsville, MD. https://www.ntep.org/data/ bg92/bg92_97-9f/bg92_97-9f.pdf
- 21. Morris, K. (2018). 2013 National bermudagrass test. Final Report NTEP No. 18-14. National Turfgrass Evaluation Program, Beltsville Agriculture Research Center, Beltsville, MD. https://www.ntep.org/data/ bg13/bg13_18-14f/bg13_18-14f.pdf
- 22. Munshaw, G. C., Beasley, J. S., Baldwin, C. M., Moss, J. Q., Cropper, K. L., Philley, H. W., Segars, C. A., & Stewart, B. R. (2017). Nitrogen and sprigging rate effects on ‘Latitude 36’ hybrid bermudagrass establishment. HortTechnology, 27, 382–385. https://doi.org/10.21273/HORTTECH03628-16
- 23. Munshaw, G. C., Williams, D. W., & Cornelius, P. L. (2001). Management strategies during the establishment year enhance production and fitness of seeded bermudagrass stolons. Crop Science, 41, 1558–1564. https://doi.org/10.2135/cropsci2001.4151558x
- 24. Patton, A. J., Hardebeck, G. A., Williams, D. W., & Reicher, Z. J. (2004). Establishment of bermudagrass and zoysiagrass by seed. Crop Science, 44, 2160–2167. https://doi.org/10.2135/cropsci2004.2160
- 25. Patton, A. J., Richardson, M. D., Karcher, D. E., Boyd, J. W., Reicher, Z. J., Fry, J. D., McElroy, J. S., & Munshaw, G. C. (2008). A guide to establishing seeded bermudagrass in the transition zone. Applied Turfgrass Science, 5, 1–19. https://doi.org/10.1094/ATS-2008-0122-01-MD
- 26. Petrovic, A. M. (1990). The fate of nitrogenous fertilizers applied to turf- grass. Journal of Environmental Quality, 19, 1–14. https://doi.org/10. 2134/jeq1990.00472425001900010001x
- 27. Philley, W. H., & Krans, J. V. (1998). Turf performance of seeded bermudagrass cultivars. Golf Course Management, 66, 62–66.
- 28. Rice, L., Beasley, J., Gaston, L., Sanders, K., & Munshaw, G. (2019). Planting rate and nitrogen fertility affect runoff losses during hybrid bermudagrass establishment. Agrosystems, Geosciences & Environment, 2, 1–5. https://doi.org/10.2134/age2019.07.0057
- 29. Schiavon, M., Macolino, S., Leinauer, B., & Ziliotto, U. (2016). Seasonal changes in carbohydrate and protein content of seeded bermudagrasses and their effect on spring green-up. Journal of Agronomy and Crop Science, 202, 151–160. https://doi.org/10.1111/jac.12135
- 30. Schmidt, R. E., & Chalmers, D. R. (1993). Late summer to early fall application of fertilizer and biostimulants on bermudagrass. International Turfgrass Society Research Journal, 7, 715–721.
- 31. Shoji, S., Delgado, J., Mosier, A., & Miura, Y. (2007). Use of controlled release fertilizers and nitrification inhibitors to increase nitrogen use efficiency and to conserve air and water quality. Communications in Soil Science and Plant Analysis, 32, 1051–1070. https://doi.org/10.1081/CSS-100104103
- 32. Wilson, M. L., Rosen, C. J., & Moncrief, J. F. (2010). Effects of polymer-coated urea on nitrate leaching and nitrogen uptake by potato. Journal of Environmental Quality, 39, 492–499. https://doi.org/10.2134/jeq2009.0265
Subscribe to Golfdom

If you enjoyed this article, subscribe to Golfdom to receive more articles just like it.